Protein content, gluten quality and flour strength: what the numbers mean for your dough
Protein percentage is the number on every flour label, but it tells only half the story. This article explains how protein quantity, gluten quality (wet gluten, gluten index, gliadin/glutenin balance), and flour strength indicators (water absorption, alveograph W, farinograph stability) interact to determine what a flour will actually do in your bakery — and how to read those numbers across the Domson catalogue, from a pastry flour at 8% protein to a strong white bread flour at 13% and a vital wheat gluten concentrate at 75%.
Why protein is only half the story
Walk into any bakery supplier and you will hear protein percentage quoted as the single measure of flour quality. "This one is 13% — it's strong." But two flours at 13% protein can behave completely differently in the oven. One gives a tall, open-crumbed sourdough that holds shape for 20 hours of fermentation. The other collapses after four hours and produces a gummy, low-volume loaf.
The difference is gluten quality — what kind of protein is in the flour, and how well it forms the elastic network that traps gas, supports structure, and survives mixing and fermentation. Protein quantity is the starting point. Gluten quality is what converts that quantity into performance.
This article maps the full picture: from the chemistry of gliadin and glutenin, through every spec-sheet parameter you can use to assess quality before committing to a flour, to a practical comparison of the flours available in the Domson catalogue.
 Microscopic or schematic diagram of a gluten network in bread dough, showing interwoven protein strands representing gliadin (extensible, short strands) and glutenin (elastic, longer chains) forming a three-dimensional mesh that traps gas bubbles.
1. What gluten actually is
The two proteins that make bread possible
Wheat flour contains many proteins, but two families are responsible for gluten formation: gliadins and glutenins. When flour is hydrated and mechanically worked, these proteins hydrate, unfold, and link together to form a three-dimensional viscoelastic network.
-
Gliadin proteins are roughly spherical when dry. Hydrated, they become sticky and flow easily — they contribute extensibility: the ability of the dough to stretch without snapping. Think of gliadin as the plasticiser that lets you roll dough out flat.
-
Glutenin proteins are large, chain-like molecules that can link to each other via disulphide bonds (S–S bonds formed between cysteine amino acid residues). They contribute elasticity: the ability to spring back after stretching. Glutenin is what makes dough snap back when you stretch it.
The key: it is the ratio and molecular weight of these two families that determines dough character. A flour with predominantly high-molecular-weight (HMW) glutenin subunits will produce a tight, elastic, gas-retaining dough — ideal for long-fermentation sourdough. A flour with high gliadin relative to glutenin will be extensible and flow easily — useful for biscuits and flatbreads, but not for tall loaves.
Why protein quantity is measured, not gluten directly
The analytical method most labs use — Kjeldahl or its near-infrared (NIR) equivalent — measures total nitrogen in the flour and multiplies by a conversion factor to estimate protein. For wheat flour, the factor is 5.7 (reflecting that wheat proteins contain approximately 17.5% nitrogen by weight).
This measures all nitrogen-containing compounds in the flour, including some non-gluten proteins. The resulting protein percentage is a proxy for gluten potential, not a direct measure of the gluten network itself.
| Flour type | Conversion factor used | Why |
|---|---|---|
| Wheat flour | N × 5.7 | Standard for wheat proteins |
| Oat flour | N × 6.25 | Different amino acid composition |
| Vital Wheat Gluten (regulatory) | N × 5.7 | EU/UK regulatory standard |
| Vital Wheat Gluten (nutritional label) | N × 6.25 | Nutritional labelling convention |
2. Protein content — what the numbers mean in practice
Typical protein ranges by application
The following ranges are cross-confirmed by BAKERpedia and the King Arthur Baking Professional Reference. Spec-sheet minimums may be lower — they are legal quality floors, not typical values.
| Application | Typical protein % | Why this level |
|---|---|---|
| Fine pastry, shortcrust, biscuits | 7–9 % | Weak, short gluten crumbles tenderly — structural strength is a defect here |
| Sponge cake, muffin | 8–10 % | Light, delicate crumb requires minimal network development |
| White sandwich bread, soft rolls | 10–12 % | Enough gluten to trap gas; not so much that the texture becomes chewy |
| Rustic bread, baguette | 11–13 % | More structure for an open crumb; supports 4–8 h fermentation |
| High-hydration sourdough, ciabatta | 12–14 % | Long fermentation (8–24 h) degrades gluten — must start from a strong baseline |
| Enriched dough (brioche, croissant) | 12–14 % | Fat and sugar dilute and disrupt gluten — needs a strong starting network |
What the Domson spec sheets confirm
Across ten reviewed products, here is what the first-party spec sheets actually commit to:
Polish wheat flours (Wągrowiec Mill specs, 2023):
- T450: protein minimum 8.0 %; wet gluten minimum 23.0 %
- T750 (Domson Bread Flour): protein minimum 10.0 %; wet gluten minimum 26.0 %
GoodMills Polska T550 Fortified (Edition 17, 2025):
- Protein range 11.5–12.5 %; wet gluten 28–32 %; gluten index 75–99
Matthews Cotswold Flour, UK:
- Windrush Strong White: protein minimum 12.0 %, target 12.2 %, maximum 12.5 %
- Light Spelt: protein minimum 9.0 %, target 11.0 %, maximum 13.0 % (wide range reflecting spelt's natural variability)
Allied Mills, UK:
- Coniston Strong White: protein minimum 12.5 %, maximum 14.5 % — the highest minimum in the catalogue, reflecting its US hard wheat origin
Whitworth Bros, UK:
- Golden Jewel Pastry Flour: protein minimum 7.5 %, target 8.5 %, maximum 9.5 %
Doves Farm Foods:
- Wholemeal Spelt Flour: protein minimum 11.8 %, maximum 17.0 % (typical nutritional value 13.3 g/100g)
- Organic Strong White 'BioBake': typical protein 12.6 g/100g from nutritional analysis
Important note: every minimum on a spec sheet is a quality floor the miller guarantees the flour will not fall below. Actual deliveries typically land higher. If your process depends on a protein value above the spec minimum — for example, a very long sourdough — request a Certificate of Analysis (CoA) for each delivery, which gives you the actual measured value for that specific lot.
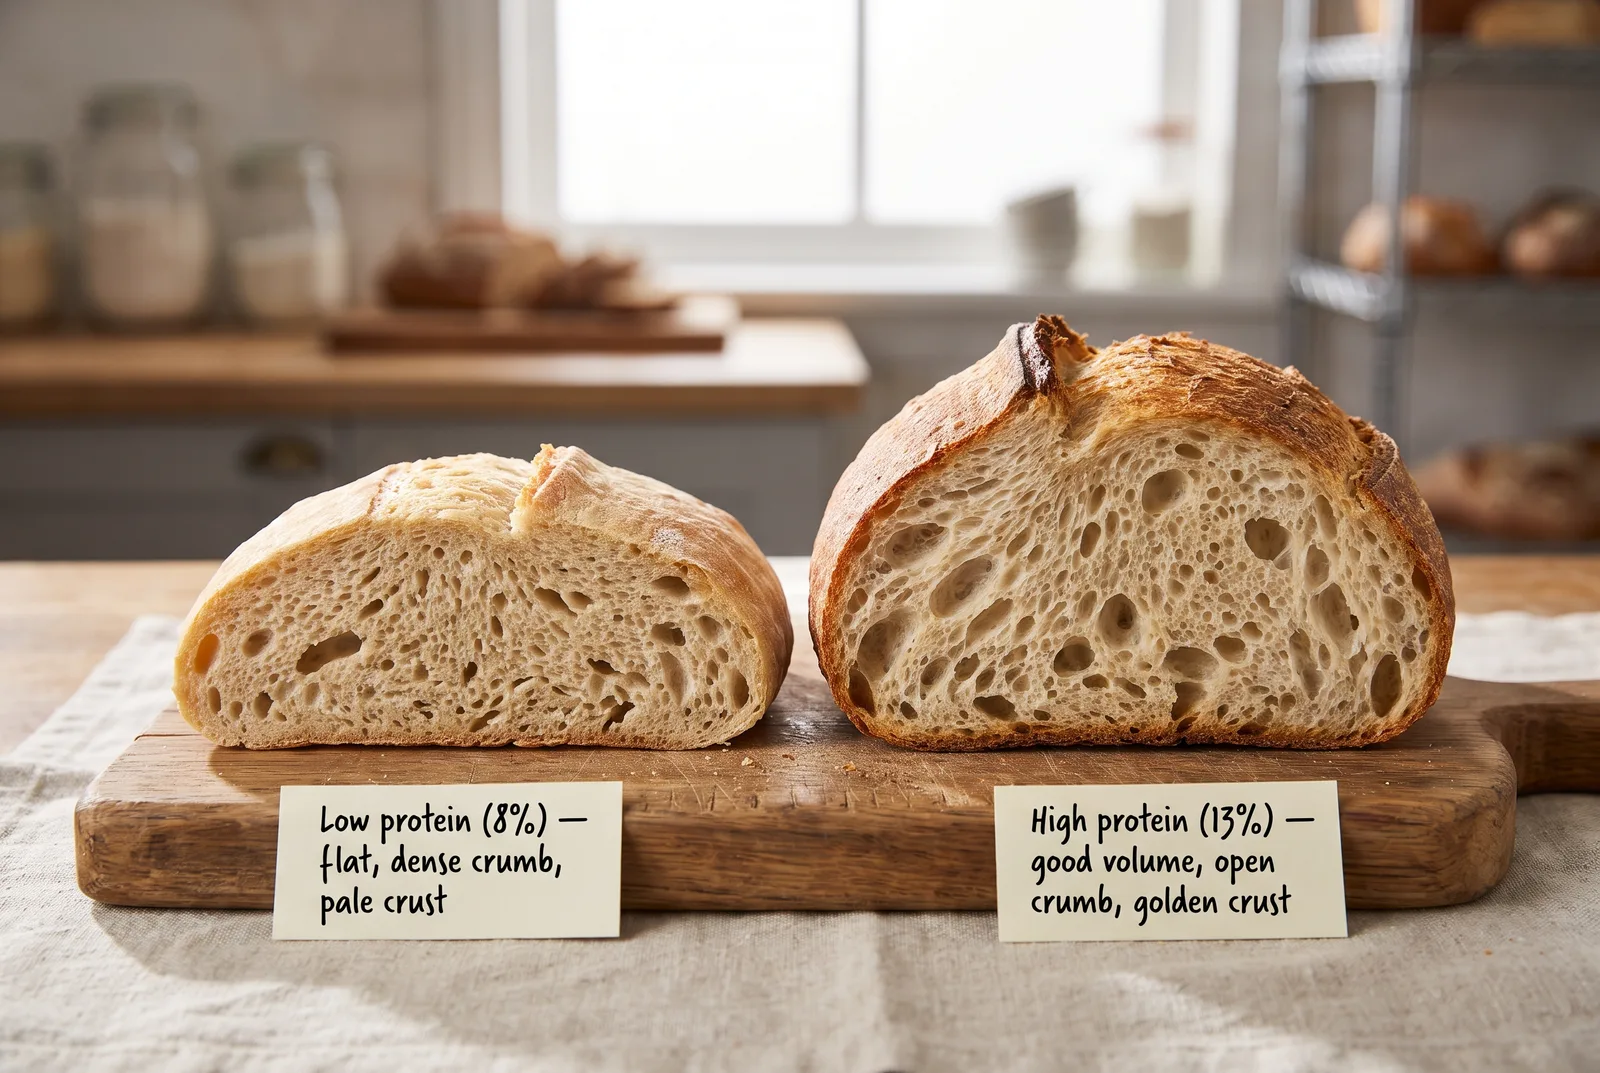
Two sliced bread loaves on a wooden board. Left loaf: made with 8% protein flour — smaller volume, pale crust, dense uneven crumb. Right loaf: made with 13% protein flour — tall, well-risen, golden crust, open regular crumb. Both loaves are cut in half to show the crumb.
3. Wet gluten and gluten index — quality beyond quantity
Why wet gluten matters more than protein %
Two flours can have identical protein content but completely different baking performance because protein quality — specifically the proportion of HMW glutenin subunits — varies between wheat varieties and growing seasons.
Wet gluten content (measured by ISO 21415) directly isolates the gluten fraction. A dough is made from the flour, then mechanically washed under water until only the rubbery, insoluble gluten remains. The mass of the wet gluten is expressed as a percentage of flour weight.
The relationship between protein and wet gluten for typical European bread wheat:
Wet gluten % ≈ Protein % × 2.7
This is a trade rule of thumb; the ratio varies widely — from approximately 2.2 to 3.0 or higher depending on variety, growing season, and protein quality (strong North American spring wheats can exceed 4.0 at very high protein). The 2.7 multiplier is a practical midpoint for European bread wheats; treat any estimate as an order-of-magnitude check only, never as a substitute for measurement in production QC.
GoodMills T550 Fortified confirms this in practice: protein 11.5–12.5% → wet gluten 28–32% (ratio ≈ 2.4–2.7 — within the expected range, confirmed in two spec editions).
The gluten index: quality in a single number
The gluten index (ISO 7495) runs from 0 to 100 and is the most useful single quality measure after wet gluten content. Here is how it works:
After the wet gluten is collected, it is placed in a centrifuge fitted with a fine sieve. Gluten that is strong and elastic enough to resist being pushed through the sieve stays above — it is "retained." The gluten index is the percentage retained.
| Gluten index | What it means | Practical implication |
|---|---|---|
| < 60 | Weak, extensible gluten — degrades easily | Collapses under fermentation; gas escapes; flat loaf |
| 60–75 | Medium — adequate for standard bread with improvers | Acceptable for most white bread; consider ascorbic acid supplement |
| 75–90 | Strong — good for commercial bread and sourdough | The target range for most bread flour applications |
| 90–99 | Very strong — may be over-tenacious | Excellent for gas retention; may fight the sheeter or moulder |
| ~ 100 | Extremely tenacious | Dough tears when rolled; may need L-cysteine to relax |
GoodMills T550 Fortified specifies gluten index 75–99 — the only flour in the reviewed Domson catalogue set that prints this parameter. This confirms the flour is strong enough for commercial bread production while remaining within a workable range for shaping and sheeting.
The Matthews and Allied Mills specs do not report gluten index — this is normal for UK millers who express quality through protein target plus water absorption. The Wągrowiec Mill specs for T450 and T750 do not report gluten index either, relying on wet gluten content as the primary quality indicator.
What to request: if your application is a long-fermentation sourdough (8 h or more) or a high-hydration formula, and your current flour spec does not include a gluten index, request it from the supplier. A flour that shows 28% wet gluten but a gluten index of 55 will underperform a flour at 25% wet gluten with a gluten index of 85.
The windowpane test — a bakery check without a laboratory
A simple practical check that any baker can run is the windowpane test: take a small piece of fully developed dough, hold it between both hands, and slowly stretch it until it is thin enough to be translucent. If you can stretch it to near-transparency without it tearing, gluten development is complete. If it tears quickly, gluten is either under-developed (mix longer) or intrinsically weak (flour protein too low or gluten quality too poor for this application).
4. Water absorption — the commercial value of gluten strength
Why water absorption matters
Water absorption is the percentage of water needed to bring a flour-water mixture to a standardised dough consistency (measured at 500 FU on the Brabender Farinograph, ISO 5530-1).
For a bakery, water absorption has direct commercial consequences: a flour at 60% water absorption can absorb 10% more water per kilogram than a flour at 50% absorption — that is 100 g more water per kg of flour, which becomes 100 g more dough at no additional ingredient cost.
Stronger, higher-protein flours generally have higher water absorption, because the expanded gluten network can hold more water without the dough becoming sticky.
What the spec sheets show
| Product | Water absorption (W/A%) | Spec source |
|---|---|---|
| Windrush Strong White Bread Flour | 55–61% (target 58%) | Windrush spec sheet |
| Matthews Light Spelt Flour | 53–65% (no target specified) | Matthews spec sheet |
| Coniston Strong White Flour | 58–61% | Coniston spec sheet |
The GoodMills T550 Fortified and Wągrowiec Mill Polish flours do not report water absorption on their standard spec sheets. For Polish flours, ask the supplier for farinograph data — it is routinely measured in quality control even when not printed on the standard specification.
Practical rule: if you change flour and the spec shows a different water absorption, adjust recipe water proportionally before your first production run. A change from 58% to 62% W/A means your dough needs approximately 4% more water (on flour weight) to reach the same consistency. Failing to adjust is one of the most common causes of unexpected sticky dough in production.
The spelt water absorption paradox
Matthews Light Spelt Flour shows a water absorption range of 53–65 % — a 12-percentage-point spread, compared to Windrush Strong White's 6-point spread (55–61%).
This wide range is not a quality problem — it reflects the natural variability of spelt grain and its more fragile gluten structure. In practice it means: test your water rate at the start of every new batch of spelt flour. Do not assume that the rate that worked with the previous sack will work with the new one.
5. Flour strength: farinograph stability and alveograph W
Farinograph stability — mixing tolerance
The Brabender Farinograph records how a dough's resistance to mixing changes over time. The key output for production bakers is stability — the duration in minutes that the curve stays above (or near) the 500 FU reference line after the dough has peaked. A long stability means the flour tolerates over-mixing and extended fermentation without structural collapse.
| Stability | Flour classification | Practical implications |
|---|---|---|
| < 3 min | Weak (cake/biscuit flour) | Do not use for yeast bread |
| 3–5 min | Medium | Standard white bread; keep fermentation under 4 h |
| 6–10 min | Strong | Bread, sourdough, rolls; fermentation 4–12 h workable |
| > 10 min | Very strong | Long fermentation, high-speed mechanical processing |
Dough development time (DDT) is the time from water addition to the peak of the curve.
| DDT | Flour type | Action |
|---|---|---|
| < 2 min | Weak — develops instantly | Short mix; avoid over-mixing |
| 2–4 min | Medium | Standard mix programmes |
| 4–8 min | Strong bread flour | May need extended mixing or rest |
| 6–12 min | Very strong / high-protein | Extended mixing required; autolyse helpful |
 Farinograph trace showing two curves on the same time-consistency chart. X-axis: time in minutes. Y-axis: consistency in FU (Farinograph Units). Strong bread flour (blue): slow rise to peak, long plateau above 500 FU, small drop — labelled with DDT, stability, and degree of softening. Weak cake flour (red): fast rise, sharp peak, rapid drop — less stable.
None of the Domson catalogue flour spec sheets reviewed report farinograph DDT or stability directly. This is normal for standard commercial spec sheets in the Polish and UK markets. GoodMills Polska and Matthews Cotswold Flour both carry out farinograph testing as part of their in-house quality control — request the data for your specific delivery if mixing time optimisation is critical.
Alveograph W and P/L — strength and machinability
The Chopin Alveograph (ISO 27971) inflates a standardised dough disk into a bubble until it bursts, producing a pressure-volume curve. It generates three key values:
- W (deformation energy, ×10⁻⁴ J): the total area under the curve — the primary single-number measure of flour strength.
- P (overpressure at peak): tenacity — resistance to deformation.
- L (abscissa at rupture): extensibility — how far the bubble stretches before bursting.
- P/L ratio: balance indicator — the most practically useful for machinability and product quality.
W classification (European milling trade convention — French/Italian practice per IREKS Compendium and UK Flour Millers; note that American sources use lower tier boundaries, and Italian panettone flour labels often specify W 380–420 — the > 350 tier is a conservative floor):
| W value (×10⁻⁴ J) | Flour category | Typical applications |
|---|---|---|
| < 100 | Very weak | Biscuits only; no gas retention |
| 100–170 | Weak | Soft cakes, wafer, sponge |
| 180–250 | Medium | French baguette, rolls, pizza (2–6 h fermentation) |
| 250–280 | Medium-strong | Sandwich bread, burger bun (4–8 h fermentation) |
| 280–350 | Strong | Ciabatta, sourdough, focaccia (8–24 h fermentation) |
| > 350 | Very strong | Panettone, brioche, babka, bagel (Italian commercial specs commonly target W 380–420) |
P/L balance for bread applications:
| P/L ratio | Gluten character | Problem / implication |
|---|---|---|
| < 0.3 | Extremely extensible | Dough spreads flat; poor gas retention; add ascorbic acid or VWG |
| 0.3–0.5 | Extensible-balanced | Good for baguette, pizza, flatbread |
| 0.5–0.7 | Balanced — ideal for most bread | Standard bread, sourdough, rolls |
| 0.7–0.9 | Tenacious | Oven spring can be good; sheeting harder — allow more rest |
| > 0.9 | Over-tenacious | Dough tears; poor shaping; consider L-cysteine or reducing rest |
 Alveograph pressure-volume curves for two flours. X-axis: abscissa L (extensibility). Y-axis: overpressure P (tenacity). Curve 1 (red, labelled 'Over-tenacious P/L > 0.9'): tall, sharp peak, short base — dough resists shaping. Curve 2 (blue, labelled 'Balanced P/L 0.5–0.7'): moderate height and width — ideal for bread. Shaded area under each curve represents W (deformation energy).
Alveograph data is not printed on any Domson catalogue spec sheet reviewed. This is structurally normal for the Polish and UK markets. French and Italian millers include it as standard; Polish and UK millers typically provide it on request. If you run an automated sheeting or lamination line, or consistently produce long-fermentation sourdough, request alveograph W and P/L from your flour supplier — they will have this data internally.
6. Spelt: when high protein does not mean strong gluten
Spelt (Triticum spelta) is a distinct wheat species that produces flour with protein levels that can match or exceed common wheat — the Doves Farm Wholemeal Spelt Flour specifies protein 11.8–17.0 %, and Matthews Light Spelt targets 11.0 %. Yet spelt dough consistently behaves as if it were much weaker.
The reason is structural: spelt has a lower proportion of HMW (high-molecular-weight) glutenin subunits compared to common wheat. HMW glutenins are the primary source of elasticity and gas-retention in the gluten network. Spelt gluten is dominated by more extensible, lower-molecular-weight proteins — it stretches easily but tears and collapses more readily than wheat gluten of the same percentage.
Practical consequences for spelt baking
| Property | Common wheat | Spelt |
|---|---|---|
| Over-mixing tolerance | High — stability > 7 min typical for strong bread flour | Low — collapses quickly after peak; autolyse is strongly recommended |
| Fermentation tolerance | Good — gluten survives 8–16 h acidic fermentation | Limited — acidic hydrolysis of fragile gluten is faster; target < 8 h for standard spelt |
| Water absorption | Consistent within a small range (e.g. Windrush: 55–61%) | Wide, variable range (Matthews Light Spelt: 53–65%) — test every batch |
| Oven spring | Strong when dough correctly developed | Fragile — if over-fermented or over-mixed, collapses in oven |
Food-safety notice: Under EU Regulation 1169/2011 Annex II and UK Food Information Regulation 2014, spelt is listed as a variety of wheat under the "cereals containing gluten" category (Entry 1 names wheat "such as spelt and khorasan wheat"). In practice this means: the word SPELT (or SPELT WHEAT) must appear explicitly and with emphasis in the allergen declaration and ingredients list of any downstream product — a generic "contains gluten" or "contains wheat" is not sufficient to identify the specific cereal. Current FSA guidance and industry practice require the spelt grain to be named. Matthews Light Spelt spec confirms the allergen as "Made from spelt."
7. Vital Wheat Gluten — boosting protein when the flour is not strong enough
Vital Wheat Gluten (VWG) is produced by washing wheat starch out of a hydrated dough under water, then drying the remaining gluten fraction. The product in the Domson catalogue — BeneoPro VWG 75 (BENEO-Orafti) — specifies:
- Protein: minimum 75 g/100g d.m. (N×5.7); typical 79.5 g/100g (N×6.25)
- Water binding capacity: approximately 140–170 g water per 100 g VWG (AACC 56-30 method)
- Moisture: maximum 8 g/100g
- Ash: maximum 1 g/100g
The low moisture is critical — dry VWG stays inert until the dough is mixed. The high water binding (up to 1.7 times its weight in water) means that every addition of VWG requires a corresponding increase in recipe water.
When to use VWG
- Protein correction: adding VWG to a lower-protein flour to reach a target protein for a specific application.
- Seasonal variation compensation: maintaining consistent dough behaviour across seasons when grain protein varies.
- High-fibre bread: added bran fibre particles physically cut gluten strands — VWG restores network integrity.
- Rye and alternative grain blends: rye flour lacks wheat-equivalent gluten; VWG addition improves structure in mixed-grain loaves.
Dosage estimation
A rough calculation for protein correction using BeneoPro VWG 75:
VWG dose (% on flour weight) ≈ (Target protein % − Base flour protein %) × 1.35
Example: raising a T450 (min 8.0%) to 12.0%: (12.0 − 8.0) × 1.35 = 5.4 % VWG on flour weight Additional water needed: approximately 5.4 × 1.55 = 8.4 % additional water (using mid-range water binding of 155 g/100g).
Verify all dosage calculations with a trial bake before committing to production. VWG increases dough development time (longer mixing needed) and can make dough feel tighter initially.
Allergen notice: BeneoPro VWG 75 is a concentrated GLUTEN source. All products containing VWG must carry a gluten allergen declaration. There are no other declarable allergens in the BENEO VWG 75 product per its specification sheet.
8. Ascorbic acid — the hidden strength booster
Several flour spec sheets in the Domson catalogue mention ascorbic acid (Vitamin C, E300) as a declared flour treatment agent:
- GoodMills T550 Fortified: "some batches of flour can contain dough processing aid substances: Ascorbic acid (Vitamin C, E300), enzymes. In each case, it will be declared in the Quality documentation attached to the delivery."
- Doves Farm Organic Strong White BioBake: ascorbic acid listed in ingredients declaration.
How it works: ascorbic acid is an oxidising agent in dough. During mixing, it is rapidly converted to dehydroascorbic acid by oxygen, which then promotes the formation of disulphide bonds (S–S links) between glutenin proteins. This strengthens the gluten network, increasing W and reducing P/L — the dough becomes stronger and more elastic.
In practical terms: a flour receiving ascorbic acid will feel stronger and less sticky than the same base flour without it. If you change flour supplier and your new flour does not use ascorbic acid while the old one did, the dough may feel weaker and need a different mixing programme.
Typical ascorbic acid levels in flour are 20–200 ppm (parts per million), up to the legal maximum of 200 mg/kg (200 ppm) under UK Bread and Flour Regulations 1998 Schedule 3. At typical bread-application levels it has no detectable flavour impact on the finished bread.
Labelling note: ascorbic acid used as a flour treatment agent (E300) is a declarable food additive under UK Bread and Flour Regulations 1998 Schedule 3 and EU Regulation 1333/2008, not a non-declarable processing aid. It must be listed in the ingredients (by name or E-number) when present at functional levels in the finished flour.
9. Practical guide: choosing flour by strength requirements
Step 1: identify your fermentation time and dough type
The longer and more acidic the fermentation, the stronger the gluten needs to be at the start. Acids from sourdough fermentation (lactic and acetic acids) hydrolyse gluten proteins over time — gluten that starts at the minimum spec level will have degraded below the acceptable threshold by hour eight or twelve of fermentation.
| Fermentation type | Minimum protein target | Preferred indicators |
|---|---|---|
| Direct dough (< 2 h bulk) | 10–11 % | Wet gluten ≥ 26%, HFN ≥ 220 s |
| Overnight cold retard (8–16 h) | 11.5–12.5 % | Wet gluten ≥ 28%, gluten index ≥ 75, HFN ≥ 250 s |
| Long sourdough (16–24 h) | 12–13 % | Wet gluten ≥ 30%, gluten index ≥ 80, W ≥ 280 (request from supplier) |
| Enriched dough (brioche, croissant) | 12–13 % | High W/A% (> 58%); P/L 0.5–0.7 to allow sheeting |
Step 2: read the spec sheet systematically
Follow this checklist every time you evaluate a new flour:
- Protein % — is it above the minimum for your application?
- Wet gluten % — is it specified? Does it confirm quality beyond protein quantity?
- Gluten index — is it specified? If not, request it for sourdough or high-hydration applications.
- Falling number — above 250 s is the target for most bread (above 220 s is the legal minimum floor).
- Water absorption (W/A%) — note it and adjust recipe water accordingly.
- Allergen declaration — mandatory review before any product launch.
- Processing aids — check whether ascorbic acid or enzymes may be added; this affects dough behaviour and labelling.
Step 3: when the spec sheet is not enough
Request additional data from your supplier in these situations:
| When you need | What to request |
|---|---|
| Long fermentation sourdough (> 8 h) | Zeleny sedimentation index; alveograph W |
| Automated sheeting or lamination | Alveograph P/L ratio |
| High-output continuous mixer | Farinograph DDT and stability |
| Rye or alternative grain blends | Amylograph peak viscosity for rye; protein analysis for the blend |
| Seasonal protein variation complaints | Certificate of Analysis (CoA) per delivery lot |
10. Flour comparison: a quick-reference for the Domson range
The full comparison table extracted from spec sheets is below.
Key takeaways by product group:
For pastry, cakes, biscuits: Use Golden Jewel Pastry Flour (Whitworth Bros, protein 7.5–9.5%, target 8.5%). A lower-gluten flour is not a compromise — it is the correct tool for short, tender baked goods.
For everyday white bread and rolls: Use GoodMills T550 Fortified (protein 11.5–12.5%, wet gluten 28–32%, gluten index 75–99, HFN ≥ 220 s). This is the most completely specified flour in the catalogue — it gives you all four key quality numbers.
For rustic, higher-extraction bread: Use Domson Bread Flour T750 (protein min 10.0%, wet gluten min 26.0%). The higher ash content (max 0.82%) provides mineral complexity and naturally occurring fermentation feed, which compensates partially for the lower protein minimum. Combine with a 48-hour cold retard only if you confirm incoming protein via CoA.
For premium sourdough and long fermentation: Use Windrush Strong White (Matthews, protein 12.0–12.5%, HFN 250–400 s target 350, W/A 55–61%) or Coniston Strong White (Allied Mills, protein 12.5–14.5%, HFN min 250, W/A 58–61%). Both are consistently specified for the UK premium bread flour market. Windrush contains < 1.5% added VWG as a declared ingredient to meet its protein specification — VWG is an ingredient (not a statutory additive) and must appear in the ingredients list with an allergen declaration for wheat/gluten.
For spelt products: Matthews Light Spelt (protein target 11%, W/A 53–65%, HFN min 220) for white spelt bread; Doves Farm Wholemeal Spelt (protein min 11.8%, typical 13.3%) for wholegrain spelt loaves and crackers. Reduce mixing time, avoid long acidic fermentation, and test water rate per batch. Declare SPELT WHEAT (with appropriate emphasis) in the allergen statement and ingredients list on all downstream products — a generic "contains gluten" is not sufficient.
For protein supplementation: BeneoPro VWG 75 (BENEO, protein min 75% d.m., water binding 140–170 g/100g) when you need to raise flour protein, compensate for seasonal variation, or restore gluten structure in high-fibre or rye-wheat blends. Declare GLUTEN allergen on all products.
Coverage notes and gaps
Well-covered by spec sheets: Protein %, wet gluten %, gluten index (GoodMills only), falling number, and water absorption are all documented from first-party spec sheets across 10 products. GoodMills T550 parameters are cross-confirmed in two spec editions (2016 and 2025). Matthews Windrush protein and HFN specifications are corroborated by the Allied Mills Coniston spec (both 12+ % protein, HFN min 250 s for UK premium bread flour).
Medium confidence: The wet gluten ÷ protein ratio (×2.7 estimate) is a widely cited trade rule of thumb; the ratio varies 2.5–3.0 by variety and season. No peer-reviewed primary source was accessed in this session. Alveograph W tier boundaries are European milling trade convention — American sources use different boundaries.
Gaps (not covered by spec sheets reviewed): No alveograph W or P/L data was found on any reviewed Domson spec sheet. No Zeleny sedimentation values appear on any Polish flour spec sheet in the catalogue. No farinograph DDT or stability values are printed on any spec sheet. Bakers requiring these parameters for process optimisation should request them directly from GoodMills Polska, Matthews Cotswold Flour, or Allied Mills.
Follow-up recommended: A1-rye-flour-guide (covering amylograph and rye falling number in detail) and A3-bread-improvers-overview (covering ascorbic acid, L-cysteine, and VWG as functional additives in context) are the recommended companion articles.
Figures
 Two dough balls placed side by side on a floured surface. Left ball: made from low-protein (8%) pastry flour — it has spread and flattened after resting, with a flat puddle shape. Right ball: made from high-protein (13%) bread flour — it stands tall and domed, holding its shape. Both are labelled with their protein percentages.
Converting protein % to estimated wet gluten %
A quick estimator for situations where the spec sheet gives protein but not wet gluten. Assumes typical European bread wheat. Accuracy varies by variety and season.
Wet gluten (%) ≈ Protein (%) × 2.7
Worked example
| Flour | GoodMills T550 Fortified |
| Protein | 12.0 % |
| Estimated wet gluten | 12.0 × 2.7 = 32.4 % |
| Spec actual | 28–32 % (per spec sheet) |
| Note | Estimate is within the spec range — method is valid as a rough check. Ratio varies 2.5–3.0× depending on variety and season. |
Estimating VWG dose to reach a protein target
How much BeneoPro VWG 75 to add to raise flour protein to a target level.
VWG dose (% on flour weight) = (Target protein % − Base protein %) ÷ (VWG protein % − 100 %) Simplified for VWG 75 (N×5.7): VWG dose ≈ (Target protein − Base protein) × 1.35
Worked example
| Base flour | Wheat Flour T450, protein min 8.0 % |
| Target protein | 12.0 % |
| Vwg protein | 75 % (N×5.7) |
| Dose calculation | (12.0 − 8.0) × 1.35 = 5.4 % VWG on flour weight |
| Water addition | Add approx. 5.4 × 1.55 = 8.4 % additional water (based on VWG water binding 155 g/100g mid-range) |
General guidance ranges drawn from BAKERpedia, King Arthur Baking Professional Reference, and UK Flour Millers. Spec-sheet confirmed values from Domson catalogue products are shown in the final column. Where a spec lists only a minimum, typical values will be higher.
| Baking application | Typical protein % (N×5.7) | Wet gluten % (approximate) | What a weak gluten does | What a strong gluten does | Matched Domson product (spec-confirmed protein) |
|---|---|---|---|---|---|
| Fine pastry, shortcrust, biscuits | 7–9 % | 18–24 % | Crumbles tenderly — desirable | Tough, chewy texture — undesirable | Golden Jewel Pastry Flour (target 8.5 %, spec sheet) |
| Sponge cake, muffin | 8–10 % | 22–26 % | Light, delicate crumb — desirable | Rubbery, tunnelled crumb | Wheat Flour T450 (min 8.0 %, spec sheet) |
| White sandwich bread, soft rolls | 10–12 % | 26–32 % | Flat loaf, poor gas retention | Good rise, elastic crumb | GoodMills T550 (11.5–12.5 %, spec sheet) |
| Rustic bread, baguette, sourdough (short to medium ferment) | 11–13 % | 28–35 % | Collapses during proof | Good open crumb, oven spring | Domson Bread Flour T750 (min 10.0 %, typical higher; spec sheet) |
| High-hydration sourdough, ciabatta (8–24 h ferment) | 12–14 % | 30–38 % | Dough cannot hold structure during long ferment | Network holds against acidic degradation | Windrush Strong White (target 12.2 %) / Coniston Strong White (min 12.5 %) — both per spec sheet |
| Croissant, Danish, viennoiserie | 11–13 % | 28–35 % | Layers collapse, no lift | Good lamination, clean lift — avoid over-tenacious gluten | Windrush Strong White (target 12.2 %, W/A 58 %, spec sheet) |
| Enriched sweet dough (brioche, babka, panettone) | 12–14 % | 32–40 % | Fat and sugar destroy weak gluten network | Gluten resists fat loading; holds gas | Coniston Strong White (min 12.5 %, spec sheet) |
| Spelt bread (standard ferment) | 9–13 % (wide range) | 22–35 % (variable) | Spreads; spelt gluten is naturally more fragile | Good structure but still more fragile than wheat — avoid over-mixing | Matthews Light Spelt (target 11.0 %); Doves Wholemeal Spelt (min 11.8 %) — both per spec sheet |
Protein percentages above are general practitioner benchmarks from multiple trade sources (c50). Actual spec-sheet minimums may be lower — always check the mill's typical value or Certificate of Analysis, not just the minimum. Wet gluten in the table is approximate (protein × ~2.7; ratio varies ~2.2–3.0+ in practice). Food-safety note: all wheat and spelt flours contain GLUTEN. Under EU Reg 1169/2011 Annex II spelt is listed as a variety of wheat under 'cereals containing gluten'; in practice SPELT WHEAT must be named explicitly with emphasis in allergen declarations and ingredients lists — 'contains gluten' or 'contains wheat' is not sufficient.
All parameters taken directly from supplier specification documents. 'Min' and 'Max' are specification limits; 'Target' is the mill's intended value where stated. Method for protein: NIR or Kjeldahl × N factor (5.7 for wheat, 6.25 for VWG/oat per spec). Wet gluten: ISO 21415 / PN-EN ISO 21415. Gluten index: ISO 7495 or PN-EN ISO 7495.
| Product | Brand / Mill | Protein % — min | Protein % — target | Protein % — max | Wet gluten % — min | Wet gluten % — max | Gluten index | Falling number (s) | Water absorption % (W/A) | Spec source |
|---|---|---|---|---|---|---|---|---|---|---|
| Wheat Flour T450 25 kg | Wągrowiec Mill | 8.0 | — | — | 23.0 | — | — | min 220 | — | Wągrowiec Mill spec sheet |
| Wheat Flour T550 Fortified 25 kg (GoodMills) | GoodMills Polska | 11.5 | — | 12.5 | 28.0 | 32.0 | 75–99 | min 220 | — | GoodMills spec sheet |
| Domson Bread Flour T750 25 kg | Wągrowiec Mill | 10.0 | — | — | 26.0 | — | — | min 220 | — | Wągrowiec Mill spec sheet |
| Windrush Strong White Bread Flour 16 kg | Matthews Cotswold Flour | 12.0 | 12.2 | 12.5 | — | — | — | min 250, target 350, max 400 | 55–61 (target 58) | Matthews spec sheet |
| Stoneground White Spelt Flour 16 kg (Light Spelt) | Matthews Cotswold Flour | 9.0 | 11.0 | 13.0 | — | — | — | min 220 | 53–65 | Matthews spec sheet |
| Coniston Strong White Flour 16 kg | Allied Mills | 12.5 | — | 14.5 | — | — | — | min 250 | 58–61 | Allied Mills spec sheet |
| Golden Jewel Pastry Flour 16 kg | Whitworth Bros | 7.5 | 8.5 | 9.5 | — | — | — | — | — | Whitworth Bros spec sheet |
| Wholemeal Spelt Flour 25 kg | Doves Farm Foods | 11.8 | — | 17.0 | — | — | — | — | — | Doves Farm spec sheet |
| Organic Strong White Bread Flour 25 kg (BioBake) | Doves Farm Foods | — | 12.6 (typical) | — | — | — | — | — | — | Doves Farm spec sheet |
| BeneoPro VWG 75 Vital Wheat Gluten 25 kg | BENEO (Südzucker Group) | 75.0 (N×5.7, d.m.) | 79.5 (N×6.25, typical) | — | — | — | — | — | water binding: 140–170 g/100g | BENEO spec sheet |
UK flours (Matthews, Allied Mills, Whitworth Bros) report protein using N×5.7 via NIR. Polish flours (GoodMills, Wągrowiec Mill) use PN-EN ISO 20483 (Kjeldahl N×5.7 for wheat). Beneo VWG uses N×5.7 for regulatory purposes and N×6.25 for nutritional labelling. Golden Jewel: Vital Wheat Gluten may be added to meet the protein specification per spec notes — this is a non-declarable processing aid but would contribute to allergen burden. Neither oat flour (Agrol) nor rye flours specify a protein quality minimum (wet gluten or gluten index) — rye does not form a classical wheat gluten network.
Cross-reference of the key rheological and chemical tests. Test method ISO references included. Sources: UK Flour Millers testing booklet, IREKS Compendium, BAKERpedia.
| Indicator | What it measures | ISO method | When it matters most | Reported on Domson spec sheets? | Typical range — weak flour | Typical range — strong flour |
|---|---|---|---|---|---|---|
| Protein % (N×5.7) | Total nitrogen-containing compounds — a proxy for potential gluten quantity | ISO 20483 / NIR | All applications; first filter in flour selection | Yes — all reviewed wheat specs | 7–9 % | 12–14 % |
| Wet gluten % | Actual hydrated gluten fraction after mechanical washing | ISO 21415 | Bread, fermented goods; better predictor than protein % | Yes — all Polish wheat specs; not Matthews UK specs | 18–24 % | 28–38 % |
| Gluten index (0–100) | Proportion of wet gluten that is elastic enough to be retained by a sieve | ISO 7495 | Sourdough, ciabatta, automated sheeting lines; distinguishes protein quality | Only GoodMills T550 (75–99) | < 60 (fragile, extensible) | 75–99 (strong, elastic) |
| Hagberg Falling Number (s) | Alpha-amylase enzyme activity; indirectly indicates risk of pre-harvest sprouting | ISO 3093 | All yeast/sourdough breads; critical for fermentation control | Yes — all wheat specs | < 200 (sprout damage risk) | 250–400 (enzyme-balanced) |
| Farinograph water absorption (%) | Water needed to reach 500 FU consistency — affects dough yield and recipe hydration | ISO 5530-1 | Recipe development; yield costing; mixing line calibration | Matthews & Allied Mills only (W/A%) | 50–55 % | 58–68 % |
| Farinograph development time (DDT, min) | Time from water addition to peak consistency — indicates mixing requirement | ISO 5530-1 | Setting mixer time; assessing need for improver | Not on Domson spec sheets | < 2 min | 6–12 min |
| Farinograph stability (min) | Duration dough holds above 500 FU — mixing tolerance and fermentation robustness | ISO 5530-1 | Long fermentation, automated high-speed lines | Not on Domson spec sheets | < 3 min | > 7 min |
| Alveograph W (×10⁻⁴ J) | Total deformation energy — the most-used single number for 'flour strength' | ISO 27971 | Ciabatta, sourdough, croissant, automated lines; common in French/Italian milling | Not on any Domson spec sheet | < 170 | 280–350 |
| Alveograph P/L ratio | Balance of tenacity (P) to extensibility (L) — affects machinability and oven spring | ISO 27971 | Sheeting, lamination, baguette, pizza | Not on any Domson spec sheet | < 0.3 (over-extensible) or > 0.9 (over-tenacious) | 0.5–0.7 (balanced bread flour) |
Alveograph W and P/L data are not printed on standard Domson catalogue spec sheets but are available on request from GoodMills Polska and from Matthews Cotswold Flour. The absence of alveograph data is structurally normal for the Polish and UK mass-market flour sectors. French and Italian millers routinely include alveograph data.
Based on BeneoPro VWG 75 spec (protein min 75 g/100g d.m., N×5.7; water binding 140–170 g/100g). Calculations assume base flour protein at spec minimum. Exact effect depends on base flour protein content and VWG protein content — verify with supplier calculator.
| Scenario | Base flour | Base flour protein (min spec) | Target protein | Approximate VWG addition (% on flour weight) | Expected additional water absorption | Notes |
|---|---|---|---|---|---|---|
| Boost T450 (min 8%) to white bread standard | Wheat Flour T450 | 8.0 % | 11.5–12 % | 4.5–5.5 % | +6–8 % (total W/A rises to approx 58–63%) | Also declare additional GLUTEN allergen; check dough consistency closely — VWG absorbs significantly more water |
| Boost T750 rustic loaf for long fermentation | Domson Bread Flour T750 | 10.0 % | 12–13 % | 2.5–3.5 % | +3.5–5 % additional water absorption | T750 has higher ash — VWG addition will improve gluten strength without changing flavour profile |
| Correct seasonal variation in T550 | GoodMills T550 Fortified | 11.5 % (range 11.5–12.5 %) | 12.5 % | 0.5–1.5 % | +0.7–2 % additional water absorption | Low dose — blends invisibly; monitor dough feel and adjust water |
| High-fibre bread (added bran dilutes gluten) | GoodMills T550 Fortified + 10% wheat bran | ~10.5 % (after bran dilution) | 12 % | 2.0–3.0 % | +2.8–4 % additional water absorption | Bran particles cut gluten strands — VWG compensates; typical in high-fibre premium bread |
Food-safety: VWG is a concentrated GLUTEN source. All products containing VWG must declare 'gluten' as an allergen. BeneoPro VWG 75 contains no other declarable allergens per its specification sheet. Store VWG below 20°C at <60% relative humidity to prevent pre-hydration. Shelf life 36 months in original packaging per spec.
Based on Domson catalogue spec sheets for spelt (Matthews Light Spelt, Doves Farm Wholemeal Spelt) versus wheat (GoodMills T550, Windrush Strong White). Note: alveograph and farinograph data for spelt are from trade literature (IREKS) not from spec sheets.
| Property | Common wheat (T. aestivum) | Spelt (T. spelta) | Practical implication |
|---|---|---|---|
| Protein range (spec confirmed) | 8.0–14.5 % (wide; variety dependent) | 9.0–17.0 % (very wide; both Matthews and Doves Farm specs confirm) | Spelt protein can match or exceed wheat, but higher protein does not equal stronger gluten |
| Gluten structure | High HMW glutenin content — strong, elastic network; withstands long fermentation | Lower HMW glutenin ratio — weaker, more extensible network; more prone to degradation | Spelt doughs need shorter mixing, gentler handling, and often shorter fermentation than wheat |
| Water absorption (W/A %) | 55–68 % (spec-confirmed: Windrush 55–61%, Coniston 58–61%) | 53–65 % (spec-confirmed: Matthews Light Spelt W/A range) | Spelt has a wider absorption range — weigh water carefully and adjust per batch |
| HFN minimum | min 220 s (all Polish specs); min 250 s (UK premium bread flour specs) | min 220 s (same floor as wheat — Matthews Light Spelt spec) | Same enzyme baseline required; no difference in minimum |
| Mixing tolerance | High (strong gluten withstands extended mixing in farinograph) | Low — farinograph stability markedly shorter for spelt; over-mixing collapses structure quickly | Stop mixing as soon as dough is developed; autolyse method preferred |
| Fibre content (wholemeal) | Wholemeal wheat: ~10–13 g/100g dietary fibre | Doves Farm Wholemeal Spelt: 8.5 g/100g — lower than wholemeal wheat despite being wholegrain | Do not make fibre equivalence claims between wholemeal wheat and wholemeal spelt without checking analysis |
| Allergen status | Gluten — wheat (must be declared) | Gluten — SPELT (separate named allergen under EU Reg 1169/2011 Annex II; must be declared as SPELT, not just wheat) | Critical: label 'contains GLUTEN (SPELT WHEAT)' — a cross-contamination disclaimer for wheat is NOT sufficient for spelt-specific declaration |
Food-safety flag: under EU Regulation 1169/2011 Annex II and UK FIR 2014, spelt is listed as a variety of wheat under the 'cereals containing gluten' category. In practice the word 'SPELT' (or 'SPELT WHEAT') must appear with emphasis in allergen declarations — 'contains gluten' or 'contains wheat' alone is insufficient to identify the specific cereal to spelt-sensitive consumers. Matthews Light Spelt spec allergen: 'Made from spelt'. Doves Farm Wholemeal Spelt spec states 'Contains gluten (naturally present in spelt)'.
| Fault symptom | Most likely protein / gluten cause | Spec parameter to check | Correction |
|---|---|---|---|
| Loaf collapses during proofing or in early oven — 'blows out' sideways | Protein too low or gluten index too low — gas not retained | Check wet gluten % and gluten index on delivery CoA | Switch to higher-protein flour; add VWG 1–3% on flour; reduce fermentation time temporarily |
| Dough too tight and tears when sheeting or moulding | Gluten over-tenacious: P/L ratio too high; or over-developed (too long mixing) | Check if W/A% is very high (>63%); request alveograph P/L from supplier | Rest dough 15–20 min before sheeting; add 0.01–0.05% L-cysteine; use flour with lower P/L |
| Dough very sticky and slack, spreads flat on bench | Protein too low for application; or high HFN flour + enzyme-poor — poor gas feed | Check protein %, gluten index, and HFN; if HFN > 350 add diastatic malt 0.1–0.3% | Use higher-protein flour or add VWG; add ascorbic acid 30–50 ppm to firm gluten |
| Gummy crumb, bread sticks to the knife | Starch over-hydrated; can be caused by very high protein flour with excessive water absorption | Check W/A% — if > 65%, reduce recipe water; also check HFN (low HFN causes gummy crumb independently) | Reduce water addition; recalibrate recipe using W/A% from spec; verify HFN on delivery |
| Spelt bread collapses during final proof or first 10 min of baking | Over-mixing broke down fragile spelt gluten network | Spelt has no gluten index on spec — assess by dough feel and mixer time log | Cut mixing time by 30%; use autolyse (flour + water rest 20–30 min before mixing); avoid high-speed mixing |
| Loaf volume consistently lower after switching flour supplier | Protein or gluten quality change between old and new flour | Compare protein %, wet gluten %, gluten index, HFN between old and new spec sheets | Request CoA for each delivery; if protein matches but quality is lower, request Zeleny or alveograph W from supplier |
| Croissant layers merge and product is doughy instead of flaky | Gluten too strong (high P/L, too tenacious) — dough fights the lamination sheets | W/A% above 62% suggests very tenacious gluten; if alveograph data available check P/L > 0.75 | Use flour with target protein 11.5–12.5% and W/A target 55–60%; rest dough between folds; chill correctly |
- Wheat:
- N × 5.7
- Oat:
- N × 6.25
- Vital wheat gluten regulatory:
- N × 5.7 (regulatory EU/UK)
- Vital wheat gluten nutritional:
- N × 6.25 (nutritional label)
- Protein:
- ISO 20483 (Kjeldahl) or NIR equivalent
- Wet gluten:
- ISO 21415 / PN-EN ISO 21415 (mechanical washing, Glutomatic)
- Gluten index:
- ISO 7495 / PN-EN ISO 7495 (centrifuge sieve, 0–100 scale)
- Falling number:
- ISO 3093 / PN-EN ISO 3093 (Hagberg-Perten)
- Water absorption farinograph:
- ISO 5530-1 (Brabender Farinograph at 500 FU)
- Alveograph:
- ISO 27971 (Chopin Alveograph: W, P, L, G)
- Step 1:
- Protein % — sets the baseline expectation
- Step 2:
- Wet gluten % — confirms actual gluten quantity
- Step 3:
- Gluten index — confirms gluten quality (strength vs extensibility)
- Step 4:
- Falling number — confirms enzyme activity safe for intended fermentation
- Step 5:
- Water absorption (W/A%) — adjust recipe water accordingly
- Step 6:
- Allergen declaration — mandatory review before any product launch
- Optional step 7:
- Request alveograph W and P/L for automated lines or long fermentation
- Optional step 8:
- Request Zeleny index for high-hydration or 18+ h sourdough applications
Buy the ingredients
Catalogue products and brands referenced in this article.
Wheat Flour Type 450 25 kg

Wheat Flour Type G 550 25 kg

Domson Bread Flour Type 750 25 kg

Beneo BeneoPro VWG 75 Vital Wheat Gluten 25 kg

Windrush Strong White Bread Flour 16 kg

Stoneground White Spelt Flour 16 kg
Golden Jewel Pastry Flour 16 kg
Domson White Strong Wheat Flour 25 kg

Coniston Strong White Flour 16 kg
Organic Strong White Bread Flour 25 kg

Wholemeal Spelt Flour 25 kg