Reading the flour spec sheet: ash content, Hagberg falling number, Zeleny, farinograph and alveograph
Every flour spec sheet contains a set of technical numbers — ash content, falling number, wet gluten, protein, water absorption, Zeleny index — that tell you far more than a name ever can. This article explains what each parameter actually measures, what the numbers mean for your production, and how to cross-read the spec sheets of the real flours in the Domson catalogue.
Why the spec sheet matters more than the name
A flour sold as "bread flour" or "type 550" tells you very little on its own. Two sacks labelled T550 can behave completely differently in the oven — one gives a tight, springy crumb; the other collapses after an hour of sourdough fermentation. The difference lives in the spec sheet.
Every professional flour supplier provides a technical specification (sometimes called a Certificate of Analysis, Product Description, or Raw Material Specification). Learning to read these documents is one of the highest-return skills in production baking. This article walks through every parameter you will find on a real spec sheet, illustrated with data from the flour products in the Domson catalogue.
 An annotated flour specification sheet with coloured callout boxes highlighting the key parameters: moisture content, ash content, Hagberg Falling Number, wet gluten content, protein content, and gluten index. Each callout includes a one-line explanation.
1. Ash content — the classification number
What it measures
Ash content is the amount of mineral residue (mostly phosphates, potassium, magnesium) left after incinerating a flour sample at 550°C. It is expressed as a percentage of dry matter (% d.m.) and measured by ISO 2171 / PN-EN ISO 2171.
The central fact: the bran layer contains roughly ten times more ash than the starchy endosperm. As the miller extracts more bran into the flour, ash rises. This is why ash content is a reliable proxy for extraction rate and flour colour.
The T-type numbering system
The Polish (and broadly European) T-type system encodes ash content directly: the type number equals the ash content in milligrams per 100 g of dry flour. T550 means approximately 550 mg ash / 100 g dry flour = 0.55% ash.
The full classification is in the comparison table below.
 Side-by-side comparison of six flour samples arranged from left to right by increasing T-type number. Left: very white fine T450 flour. Centre-left: T550 slightly cream. Centre: T750 off-white with flecks. Centre-right: T850 light brown. Right-centre: T1850 Graham dark speckled. Far right: T2000 wholemeal rye with visible bran particles.
What the spec sheets say
Across nine Domson supplier spec sheets reviewed:
- T450 (Wągrowiec Mill): ash max 0.48% d.m.
- T500 (Wągrowiec Mill): ash max 0.52% d.m.
- T550 (GoodMills Polska, fortified): ash 0.51–0.58% d.m. — a range rather than a single maximum, reflecting natural seasonal variation in grain
- T750 (Wągrowiec Mill): ash max 0.82% d.m.
- T850 (Wągrowiec Mill): ash max 0.90% d.m.
- Rye T720 (GoodMills Polska): ash max 0.78% d.m.
- Rye T2000 wholemeal (GoodMills Polska): ash max 2.0% d.m.
Note that the Matthews Cotswold Flour specs (Windrush Strong White, Light Spelt) do not report ash directly — this is common for UK millers who may express flour colour as a grading score (F.C.G — Flour Colour Grade) instead.
Practical implications for bakers
| Application | Recommended ash class | Why |
|---|---|---|
| Fine pastry, shortcrust, pasta | T400–T450 | Neutral flavour, white colour, low fibre interference |
| Sponge cake, soft rolls | T500–T550 | Cream colour acceptable; slight mineral flavour enhances aroma |
| White sandwich bread | T550 | Standard European white bread flour |
| Rustic/artisan bread | T750–T850 | More flavour complexity; better fermentation from extra minerals |
| Graham bread, high-bran loaves | T1850 | Significant bran content; requires longer mixing or improver |
| Wholemeal rye | T2000 | Full grain — very dark, dense, high fibre |
A higher ash content does not automatically mean better bread — it means a different bread. Matching ash class to product type is the first decision when ordering flour.
2. Moisture content — the silent variable
All nine spec sheets reviewed set maximum moisture at 15.0% (method PN-EN ISO 712).
One exception: the Agrol Oat Flour sets a tighter limit of max 11%, reflecting oats' different lipid profile and higher rancidity risk at elevated moisture.
Why moisture matters for bakers
- Recipe hydration: If your flour arrives at 14% moisture and your recipe was developed at 13%, the flour carries an extra 1% water — your dough will be softer than expected. Conversely, dry-season flour at 12% moisture makes a stiffer dough.
- Storage safety: Flour above 14.5% is at risk of mould growth, especially at temperatures above 20°C.
- Shelf life: All reviewed wheat flour specs state a shelf life of 5 months (GoodMills, Wągrowiec Mill). Windrush Strong White (Matthews) specifies 9 months from manufacture. Oat flour is 6 months (Agrol).
Practical rule: Weigh flour by mass, not volume. Check incoming moisture if you have a moisture meter — even a 1% deviation shifts your effective absorption calculation.
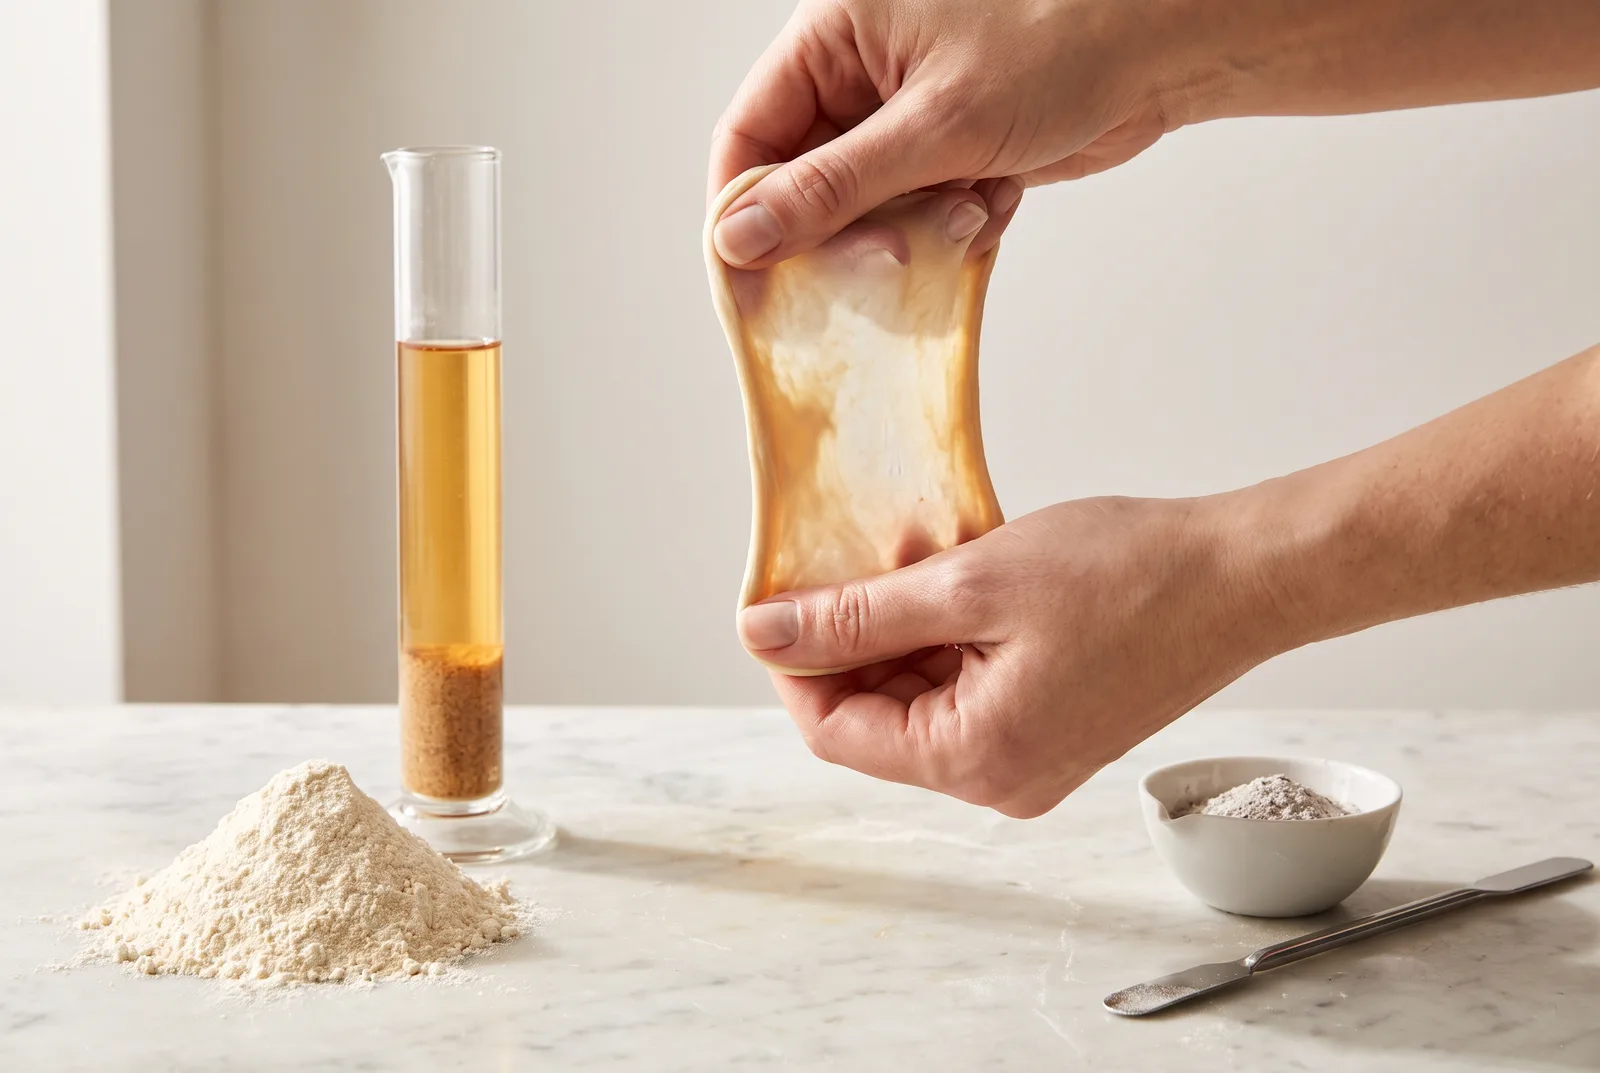
3. Protein content and wet gluten content
Two numbers for the same thing — but different things
Protein content (% by mass, typically Kjeldahl × 5.7 for wheat) measures total nitrogen-containing compounds including some non-gluten proteins. It is a fast, standard measurement.
Wet gluten content (method ISO 21415) isolates the actual gluten fraction — the stretchy viscoelastic network formed by gliadin and glutenin proteins when hydrated and mechanically worked. It requires washing the dough under water until only rubbery gluten remains.
The relationship: wet gluten ≈ 2.5–3.0 × protein % for typical European bread wheat (single-source estimate; the ratio varies by variety and growing season).
GoodMills T550 spec makes this explicit: protein 11.5–12.5% → wet gluten 28–32%.
What the specs show
| Product | Protein % (min) | Wet Gluten % (min) |
|---|---|---|
| Wheat T450 | 8.0 | 23.0 |
| Wheat T500 | 8.0 | 23.0 |
| Wheat T550 GoodMills | 11.5 (range 11.5–12.5) | 28–32 |
| Wheat T550 Komplexmłyn | 8.0 | 25.0 |
| Wheat T750 | 10.0 | 26.0 |
| Wheat T850 | — | 26.0 |
| Windrush Strong White | 12.0–12.5 | — |
| Light Spelt | 9.0–13.0 | — |
Notice that the GoodMills T550 fortified flour specifies significantly higher protein than the Wągrowiec Mill T450/T500/T550 specs. The Wągrowiec specs set 8.0% as a minimum — this is a legal floor, not a target. In practice, milled wheat will typically land higher. If protein is critical to your process, request the mill's typical value (or Certificate of Analysis per delivery) in addition to the specification minimum.
Gluten index — the quality gate
The gluten index (ISO 7495) measures what proportion of washed wet gluten passes through a fine sieve under centrifugation. It runs from 0 to 100.
- High gluten index (75–100): strong, elastic, cohesive gluten — holds gas well
- Low gluten index (< 60): weak, extensible, fragile gluten — leaks gas, causes flat bread
- Very high (close to 100): sometimes indicates over-tenacious gluten — difficult to shape or roll
The GoodMills T550 spec is the only reviewed product to specify gluten index explicitly: 75–99. This means the flour is confirmed as strong enough for commercial bread production but still within a workable range for shaping.
4. Hagberg Falling Number (HFN)
The most-misunderstood number on the spec sheet
The Hagberg Falling Number (HFN or FN) measures alpha-amylase enzyme activity in flour. It does this indirectly: a flour-water paste is gelatinised at 100°C, then a weighted plunger is dropped through it. Thin paste (high enzyme activity) offers less resistance — the plunger falls fast — giving a low HFN.
The method is ISO 3093 / PN-EN ISO 3093.
 Diagram of the Hagberg Falling Number apparatus: a glass tube filled with a cooked flour-water paste, with a weighted stirrer-plunger at the top. An arrow indicates the plunger falling through the paste under gravity. Text shows the time measurement in seconds.
Why alpha-amylase activity matters
Alpha-amylase breaks down starch chains into fermentable sugars. You need the right amount:
- Too much (low HFN, typically caused by pre-harvest sprouting): dough is sticky, bread volume collapses, crumb is gummy and wet. Unusable for standard bread without intervention.
- Too little (high HFN, dry growing season, no sprouting): dough lacks fermentation feed, Maillard browning is poor, crust stays pale, crumb is dry and tight. Needs supplementation with diastatic malt or fungal amylase.
The full interpretation table is below.
What the specs say
Every wheat flour spec from Wągrowiec Mill reviewed (T450, T500, T550, T750, T850) sets the same minimum: ≥ 220 s.
GoodMills T550 confirms: not less than 220 s.
Windrush Strong White (Matthews) sets a much tighter range: minimum 250, target 350, maximum 400 s. This reflects UK milling practice where the target for premium bread flour is well inside the optimal window.
Matthews Light Spelt Flour specifies minimum 220 s — the same floor as Polish wheat flour.
For rye flour, the falling number behaves differently — rye starch gels at a lower temperature and rye amylases are more heat-stable. GoodMills specifies a much lower minimum for both Rye T720 and Rye T2000: > 90 s. Do not compare rye HFN values directly to wheat HFN values.
Note (single-source, needs-review): The > 90 s figure is the GoodMills commercial floor to exclude severely sprouted grain. Academic literature suggests optimal rye bread-baking FN is typically 125–200 s; some EU market segregation thresholds use 110–140 s. A rye flour with FN just above 90 s may still produce acceptable baked goods, but for sourdough rye applications a higher value (above 120 s) is preferable. Confirm with your supplier if rye FN is critical to your process.
Baker's guide to acting on the falling number
| Situation | Action |
|---|---|
| HFN delivered at spec minimum (220 s), baking sourdough > 8 h | Consider adding 0.2–0.5% diastatic malt flour on flour weight |
| HFN < 200 s on incoming delivery | Reject or quarantine (practitioner rule of thumb — not a legal requirement); blend with high-HFN flour before use |
| HFN 350+ in summer wheat | Add diastatic malt (0.1–0.3% on flour) for croissant/rolls; not necessary for sourdough |
| Rye flour HFN 80–100 s | Normal — do not add malt to rye dough based on HFN alone |
5. Zeleny Sedimentation Index
The gluten quality test beyond protein content
Two flours can have identical protein content but produce completely different bread. This is because protein quantity is not the same as protein quality — the proportion of high-molecular-weight (HMW) glutenin subunits, which are the primary determinants of dough strength, varies between varieties.
The Zeleny sedimentation test (ISO 5529) captures this quality dimension. A flour-lactic acid suspension is timed: stronger gluten absorbs more lactic acid, swells more vigorously, and resists sedimentation. After a standard time interval, you measure the volume of sediment. Higher volume = stronger gluten.
 Photograph or diagram of Zeleny sedimentation test: three graduated glass cylinders containing flour suspended in lactic acid solution, showing different sediment volumes after the test period. Left cylinder has a small sediment volume (weak gluten); right cylinder has a large sediment volume (strong gluten).
Interpreting Zeleny values
The full interpretation table is below.
In summary:
- < 20 ml: weak gluten — suitable for biscuits, not bread
- 20–30 ml: weak to medium — standard white bread with improvers
- 30–45 ml: medium — standard bread, rolls
- 45–60 ml: strong — sourdough, ciabatta, long fermentation
- > 60 ml: very strong — panettone, brioche, bagel
Note (single-source, pending verification): These interpretation ranges are from trade literature (Milling and Grain). The primary cited source was inaccessible during verification (HTTP 401). BAKERpedia gives 45–65 ml for hard bread wheat and 15–25 ml for soft/blended wheat, suggesting the lower boundary of 30 ml for standard bread may be conservative. Until a second public source is confirmed, treat these as approximate practitioner benchmarks.
What the Domson specs show
None of the nine spec sheets reviewed specify Zeleny values directly — this is common in Polish milling, where wet gluten content and gluten index are the preferred quality indicators. However, based on the GoodMills T550's gluten index of 75–99 and wet gluten of 28–32%, this flour would be expected to return a Zeleny in the 35–55 ml range, consistent with standard bread production.
If you are producing long-fermentation sourdough or high-fat enriched dough and the spec sheet does not include Zeleny, request it from your supplier or have an independent test run on incoming lots.
6. Farinograph — understanding dough in real time
The farinograph (Brabender Farinograph, ISO 5530-1) measures how a dough responds to mixing over time, at a standardised consistency of 500 FU (Farinograph Units).
It produces a characteristic curve from which four key parameters are read:
 Farinograph curve: a time-torque chart showing the characteristic banana-shaped dough resistance curve. Annotated lines show water absorption point (500 FU), dough development time at peak, stability band, and the drop indicating over-mixing.
The four farinograph parameters
1. Water absorption The percentage of water needed to bring the dough to exactly 500 FU. This is also called the farinograph water absorption. Higher values indicate the flour can produce more dough weight per kg of flour (better yield).
- Typical bread flour: 55–65%
- Windrush Strong White: 55–61% (target 58%)
- Matthews Light Spelt: 53–65%
- Spelt's wider range reflects its more variable and fragile gluten behaviour.
2. Dough development time (DDT) The time from water addition to the peak of the curve. Short development times suggest soft gluten that forms quickly but cannot withstand extended mixing.
- Weak cake flour: < 2 min
- Medium bread flour: 3–6 min
- Strong bread flour: 6–10 min
3. Stability The duration the curve stays above or near 500 FU after peaking. A long stability means the flour tolerates over-mixing and extended fermentation without weakening.
- Weak: < 3 min
- Medium: 3–7 min
- Strong: > 7 min
4. Degree of softening (mixing tolerance index, MTI) The drop in FU after 12 minutes of mixing compared to the peak. A small drop indicates a tolerant dough; a large drop indicates rapid structure breakdown.
The complete classification table is below.
Practical use in the bakery
- If your mixer needs a long time to develop dough and you observe the dough tightening and then suddenly slackening, you are exceeding the stability window — use a flour with higher stability or shorten mix time.
- If dough feels bucky and tight and is hard to shape after a rest, the flour has very high stability (long DDT) — which is good for mechanical processing but may need additional rest time before shaping.
- Water absorption directly affects recipe water: a flour at 60% absorption needs 10% more water than a 50% absorption flour to achieve the same dough consistency.
7. Alveograph — measuring dough strength and extensibility
The Chopin Alveograph (ISO 27971) is the most sophisticated standard test in the suite. A standardised dough disk is inflated with air into a bubble until it bursts, producing a pressure-volume curve.
 Diagram of a Chopin Alveograph showing a dough disk being inflated into a bubble. The resulting pressure-volume curve is annotated with P (maximum pressure, tenacity) and L (length, extensibility). W equals the total area under the curve.
The three key values
W — deformation energy (flour strength) The total area under the alveograph curve, expressed in 10⁻⁴ Joules. This is the most widely used single-number indicator of flour strength.
- < 170: weak (biscuits, cakes, crackers)
- 180–260: medium (baguette, rolls, pizza)
- 280–350: strong (sourdough, ciabatta)
-
350: very strong (panettone, brioche)
Note (practitioner convention): These W boundary values reflect French/Italian milling trade practice (Chopin Technologies / BIPEA classifications). BAKERpedia and the American Society of Baking use a three-tier classification (weak < 120, intermediate 140–230, strong > 230), which places the bread-flour boundary lower. The four-tier system above is more granular and widely used by European millers and bakers, but you may encounter different breakpoints from different sources. The direction (higher W = stronger flour) is universally agreed.
P — tenacity (resistance to extension) The maximum overpressure required to inflate the bubble. High P = tight, resistant dough that is hard to shape but holds gas well.
L — extensibility The total length of the curve before the bubble bursts. High L = very extensible dough that spreads easily but may not hold its shape.
P/L ratio — the balance indicator The most practically useful ratio:
- 0.5–0.6: balanced — ideal for most bread types
-
0.7: too tenacious — dough fights the sheeter, poor oven spring
- < 0.4: too extensible — dough spreads flat, gas escapes
Note (practitioner convention): The P/L thresholds of 0.5–0.6, > 0.7 and < 0.4 are French/Italian milling practice conventions. BAKERpedia and ASBE classify strong flour as P/L approximately 0.7, intermediate as 0.3–0.7, and weak as approximately 0.3, without specifying an optimal sub-range. Use these figures as a guide, not an absolute standard.
For sourdough and long fermentation, the ideal combination is W 280–350 with P/L 0.5–0.6.
For croissant and ciabatta (high extensibility needed): W 200–280 with P/L < 0.5 (higher L).
What the Domson specs show
None of the reviewed Polish flour spec sheets report W, P, or L values. This is normal — the Polish milling industry uses wet gluten, gluten index and falling number as standard quality parameters, while the alveograph is more commonly specified in French and Italian flour trading.
If alveograph data is critical (e.g. you are running a fully automated line requiring tight P/L control for consistent sheeting), request it from GoodMills Polska or the milling supplier — they will often have this data internally even if not printed on the standard spec sheet.
Matthews Cotswold Flour provides water absorption (W/A%) on their spec sheets, which is a farinograph-derived parameter and partly substitutes for the alveograph's hydration insight but does not give W or P/L.
8. Reading the spec sheet in practice: a worked example
Here is how to read the GoodMills Polska Wheat Flour Type 550 spec sheet systematically:
| Step | Parameter to check | Value from spec | What it tells you |
|---|---|---|---|
| 1 | Ash content | 0.51–0.58% d.m. | Correct T550 grade; expect cream-white colour |
| 2 | Moisture | max 15% | Standard; check incoming lot with moisture meter |
| 3 | Protein | 11.5–12.5% | Strong flour — suitable for bread and long fermentation |
| 4 | Wet gluten | 28–32% | Confirms protein quality; expect 2.5× ratio |
| 5 | Gluten index | 75–99 | Strong but not over-tenacious — good for production |
| 6 | Falling number | ≥ 220 s | Acceptable minimum; supplement malt if using > 8 h fermentation |
| 7 | Fortification | Ca, Fe, B1, niacin | This flour is voluntarily fortified at levels matching UK Bread and Flour Regulations 1998 minimums — these are NOT mandated by Polish/EU regulation. Declare allergen: GLUTEN. |
9. Parameters not on the spec sheet: what to request
Some high-value parameters are typically not printed on standard spec sheets but can be requested:
| Parameter | When to request | What it helps with |
|---|---|---|
| Zeleny sedimentation index | Long fermentation, sourdough, high-hydration breads | Confirm gluten network strength beyond protein content |
| Alveograph W and P/L | Automated sheeting lines, croissant/Danish, ciabatta | Optimise mixing and lamination parameters |
| Farinograph stability and DDT | High-output mixing, continuous mixer | Set mixer timing and water temperature |
| Amylograph peak viscosity | Rye bread, malt-heavy formulas | Predict starch paste behaviour in rye sourdough |
| Starch damage % | High-water-absorption applications | Damaged starch absorbs more water; relevant for high-ash flours |
Flour type quick-reference for the Domson range
The following products from the Domson catalogue have confirmed spec sheet data referenced in this article:
Wheat flours (Polish classification):
- T450 — fine pastry, pasta: ash max 0.48%, FN ≥ 220 s, wet gluten ≥ 23%
- T500 (Domson White) — general purpose: ash max 0.52%, FN ≥ 220 s, wet gluten ≥ 23%
- T550 GoodMills Fortified — bread, rolls: ash 0.51–0.58%, FN ≥ 220 s, wet gluten 28–32%, gluten index 75–99
- T750 (Domson Bread) — rustic bread: ash max 0.82%, FN ≥ 220 s, wet gluten ≥ 26%
- T850 — brown bread: ash max 0.90%, FN ≥ 220 s, wet gluten ≥ 26%
UK wheat flours:
- Windrush Strong White (Matthews) — premium bread: protein 12.0–12.5%, FN 250–400 s (target 350), W/A 55–61%
Rye flours:
- Rye T720 (GoodMills) — light rye bread: ash < 0.78%, FN > 90 s
- Rye T2000 Wholemeal (GoodMills) — wholemeal rye: ash < 2.0%, FN > 90 s, fibre 14.4 g/100g
Other flours:
- Oat Flour (Agrol) — oat applications: moisture max 11%, protein 13 g/100g, fibre 10.3 g/100g; no ash/FN specification (not standard for oat flour). ALLERGEN NOTE: Agrol spec flags gluten cross-contamination risk. Oats are classified as a gluten-containing cereal under EU/UK law — declare GLUTEN on all products containing this flour.
- Light Spelt Flour (Matthews) — spelt bread: protein 9–13% (target 11%), FN ≥ 220 s, W/A 53–65% ALLERGEN: GLUTEN (SPELT WHEAT) — named allergen under EU Regulation 1169/2011 Annex II and UK food law; must be declared on all downstream products.
Coverage notes and gaps
Solid: Ash content, moisture, falling number, wet gluten, protein, gluten index — all well covered by first-party spec sheets from 9 confirmed products. Cross-verification with IREKS Compendium, AHDB, and BAKERpedia confirms all numeric ranges.
Thin (single source for interpretation ranges): Zeleny sedimentation interpretation scale — confirmed from Milling and Grain / UK Flour Millers trade sources, but no direct Zeleny values were found on the reviewed spec sheets. Follow-up: request Zeleny data from GoodMills Polska and Wągrowiec Mill for the next update.
Gap: Alveograph W, P, L values — none of the 9 reviewed spec sheets report these. This is structurally normal for the Polish and UK markets but limits advice precision for automated lines. Recommendation: request alveograph data for T550 and T750 from GoodMills on next contact.
Amylograph and starch damage: Not covered in this article. Relevant for rye bread specialists — schedule for a follow-up A1-rye-flour-guide article.
Ash content is measured on dry-matter basis (% d.m.) by incineration (ISO 2171 / PN-EN ISO 2171). The T-type number directly encodes the ash content in mg per 100 g dry flour. Data cross-verified against Domson supplier spec sheets.
| Type (PL) | Approx. French equiv. | Max Ash % (d.m.) | Typical Moisture limit | Primary baking use | Spec-sheet confirmed |
|---|---|---|---|---|---|
| T400–T450 | T45 | 0.48–0.50 | ≤ 15% | Fine pastry, shortcrust, pasta | Yes (max 0.48%) |
| T500 | T55 | 0.50–0.52 | ≤ 15% | General pastry, layer cakes, sponges | Yes (max 0.52%) |
| T550 | T55–T65 | 0.51–0.58 | ≤ 15% | White sandwich bread, rolls, pizza | Yes (0.51–0.58%) |
| T750 | T80 | ~0.82 | ≤ 15% | Rustic bread, semi-wholemeal loaves | Yes (max 0.82%) |
| T850 | T110 | ~0.90 | ≤ 15% | Brown bread, high-fibre loaves | Yes (max 0.90%) |
| T1850 (Graham) | — | ~1.85 | ≤ 15% | Graham bread, high-bran loaves | Inferred from type number; no direct spec read |
| T2000 (Wholemeal rye) | — | < 2.0 | ≤ 15% | Pumpernickel, wholemeal rye bread | Yes (< 2.0%) |
| Rye T720 | — | < 0.78 | ≤ 15% | Light rye bread, mixed-grain bread | Yes (< 0.78%) |
Higher T-number = more bran fraction = darker colour, stronger flavour, more dietary fibre. Extraction rate rises with T-number: T450 ≈ 65–70% extraction; T2000 ≈ 95–100% (wholemeal).
Measured by ISO 3093 / PN-EN ISO 3093. Expresses the time in seconds for a stirrer to fall through a starch paste under defined conditions. Lower number = more alpha-amylase activity (more starch breakdown).
| HFN range (seconds) | Alpha-amylase activity | What happens in baking | Baker's action required |
|---|---|---|---|
| < 150 | Extremely high (sprout damage) | Very sticky dough, flat loaf, gummy crumb, runny starch | Do not use for yeast bread; may suit flatbread if blended |
| 150–200 | High (borderline sprout damage) | Reduced loaf volume, sticky crumb, poor crust | Blend with high-HFN flour; reduce fermentation time |
| 200–250 | Moderate to adequate | Acceptable bread, some risk of stickiness on long fermentation | Monitor; may need minor amylase correction |
| 250–350 | Optimal for breadmaking | Good fermentation feed, ideal gas retention, golden crust colour | No correction needed — the target window |
| 350–400 | Low activity (enzyme-poor) | Pale crust, reduced Maillard browning, slightly dense crumb | Add diastatic malt (0.1–0.3% on flour) or fungal amylase |
| > 400 | Very low (enzyme-deficient) | Pale crust, poor volume, dry crumb — amylase starved | Must supplement with diastatic malt or exogenous amylase |
Domson spec sheets all specify HFN ≥ 220 s for wheat flours; GoodMills T550 additionally confirms ≥ 220 s. Rye flours use a lower threshold: GoodMills Rye 720 and 2000 both specify > 90 s (rye starch gels differently). The UK Windrush Strong White spec targets 350 s (range 250–400 s). Methods: wheat — PN-EN ISO 3093; rye — PN-EN ISO 3093.
Measured by ISO 5529. Flour is suspended in lactic acid solution; stronger gluten swells more, sediments slower, giving a higher ml reading after a fixed time. Both protein quantity and quality (HMW glutenin subunit composition) affect the result.
| Zeleny value (ml) | Gluten quality band | Bread-making suitability | Notes |
|---|---|---|---|
| < 20 | Poor | Unsuitable for hearth bread; suitable for biscuits/cakes only | Very weak gluten; check protein content also |
| 20–30 | Weak to medium | Enriched breads, soft rolls with improvers | Requires bread improver (ascorbic acid, DATEM) to compensate |
| 30–45 | Medium | Standard sandwich bread, rolls | Typical range for T550-class flours |
| 45–60 | Strong | Sourdough, ciabatta, baguette, long-fermentation breads | Good gluten network supports extended fermentation |
| > 60 | Very strong | Panettone, brioche, bagel, high-protein speciality bread | Often associated with hard spring wheat varieties |
Not directly measured on Domson spec sheets reviewed; recommended to request from suppliers for any flour used in long-fermentation or high-hydration production. The SDS sedimentation test (using sodium dodecyl sulphate instead of lactic acid) gives different absolute values but the same quality ranking.
Measured by ISO 27971 using the Chopin Alveograph. A dough disk is inflated into a bubble; W = total deformation energy (strength); P = maximum overpressure (tenacity); L = abscissa at rupture (extensibility); G = index of swelling.
| W value (×10⁻⁴ J) | P/L ratio | Flour type / application | Practical implication for baker |
|---|---|---|---|
| < 100 | variable | Weak flour — biscuits, shortbread, crackers | Gluten structure too weak to retain gas; do not use for yeast bread |
| 100–170 | < 0.4 (extensible) | Soft cake flour, sponge cake, wafer | Very extensible, tears easily — ideal for delicate layering |
| 180–250 | 0.4–0.6 | French baguette, rolls, pizza (moderate fermentation) | Good balance; suitable for 2–6 h fermentation |
| 250–280 | 0.5–0.7 | Standard white bread, sandwich loaf, burger bun | Robust for mechanical processing; tolerates 4–8 h fermentation |
| 280–350 | 0.5–0.7 | Ciabatta, focaccia, sourdough (long fermentation) | Strong network; supports high hydration and 8–24 h fermentation |
| > 350 | 0.5–0.8 | Panettone, brioche, babka, high-butter enriched dough | Very strong gluten holds gas under fat/sugar load |
| any W | > 0.8 | Over-tenacious (difficult to shape) | Dough tears, poor oven spring; may need reducing agent (L-cysteine) or rest time |
| any W | < 0.3 | Over-extensible (slacks out) | Gas escapes through weak gluten walls; add ascorbic acid or VWG |
Note: Domson supplier spec sheets for wheat flours do not include W/P/L values — these are typically reported on request or in miller's technical data sheets. The Windrush Strong White and Matthews Spelt specs use W/A% (water absorption from farinograph/standardised test) not the full alveograph suite. Request alveograph data from GoodMills or Wągrowiec Mill for production optimisation.
Measured at 500 FU consistency (Brabender Farinograph / equivalent). All values are indicative; actual values depend on wheat variety, growing season and milling extraction.
| Parameter | Weak flour (cake/pastry) | Medium flour (all-purpose) | Strong bread flour | Very strong (high-protein) |
|---|---|---|---|---|
| Water absorption (%) | 50–55 | 55–60 | 58–65 | 62–68 |
| Development time (min) | < 2 | 2–4 | 4–8 | 6–12 |
| Stability (min) | < 2 | 3–5 | 6–10 | > 10 |
| Degree of softening (FU after 12 min) | > 80 | 60–80 | 30–60 | < 30 |
| Farinograph Quality Number (FQN) | < 30 | 30–60 | 60–90 | > 90 |
Windrush Strong White Bread Flour water absorption: 55–61% (target 58%) — consistent with 'strong bread flour' band. Matthews Light Spelt Flour water absorption: 53–65% — wider range reflects spelt's variable gluten hydration. GoodMills T550 spec does not report farinograph parameters explicitly; the spec focuses on wet gluten (28–32%) and gluten index (75–99) as proxy quality indicators.
Parameters extracted directly from supplier specification sheets. All moisture limits max 15% (PN-EN ISO 712) unless stated. 'Wet gluten' = wet gluten content (PN-EN ISO 21415); 'Protein' = crude protein Nx5.7 (PN-EN ISO 20483 or equivalent).
| Product | Brand/Mill | Ash % max (d.m.) | Wet gluten % min | Protein % min | Falling number min (s) | Gluten index | W/A% |
|---|---|---|---|---|---|---|---|
| Wheat Flour T450 25 kg | Wągrowiec Mill | 0.48 | 23.0 | 8.0 | 220 | — | — |
| Wheat Flour T500 25 kg (Domson White) | Wągrowiec Mill | 0.52 | 23.0 | 8.0 | 220 | — | — |
| Wheat Flour T550 25 kg (GoodMills, fortified) | GoodMills Polska | 0.51–0.58 | 28–32 | 11.5–12.5 | 220 | 75–99 | — |
| Wheat Flour T550 25 kg (Komplexmłyn) | Wągrowiec Mill | 0.58 | 25.0 | 8.0 | 220 | — | — |
| Wheat Flour T750 25 kg (Domson Bread) | Wągrowiec Mill | 0.82 | 26.0 | 10.0 | 220 | — | — |
| Wheat Flour T850 25 kg | Wągrowiec Mill | 0.90 | 26.0 | — | 220 | — | — |
| Rye Flour T720 (GoodMills) | GoodMills Polska | 0.78 | — | 6.5* | > 90 | — | — |
| Rye Flour T2000 Wholemeal | GoodMills Polska | 2.0 | — | 8.4* | > 90 | — | — |
| Oat Flour 25 kg (Agrol) | Agrol | — | — | 13.0* | — | — | — |
| Windrush Strong White 16 kg | Matthews Cotswold Flour | — | — | 12.0–12.5 (target 12.2) | 250–400 (target 350) | — | 55–61 (target 58) |
| Light Spelt Flour 16 kg | Matthews Cotswold Flour | — | — | 9.0–13.0 (target 11.0) | ≥ 220 | — | 53–65 |
* Protein values marked with asterisk are from nutritional information on spec sheet (per 100g), not a quality specification limit. — = not specified in the spec sheets reviewed. GoodMills T550 is the only product in the reviewed set that specifies gluten index directly. W/A% (water absorption) appears only on Matthews spec sheets.
| Parameter misread | Mistake made | What actually happens | Correct approach |
|---|---|---|---|
| Falling number ≥ 220 s (spec minimum) | Baker assumes no amylase needed as long as spec is met | At 220 s, flour is borderline; long sourdoughs may still lack sufficient amylase activity | Target 250–320 s for sourdough; supplement with diastatic malt if HFN is at the spec minimum |
| Protein % | Baker uses protein % alone to select strong bread flour | Two flours can have the same protein % but very different gluten quality (different Zeleny / W values) | Always check wet gluten %, gluten index or Zeleny in addition to protein % |
| Ash content | Baker treats lower ash = better for all applications | Lower ash means weaker flavour, less fibre — for rustic breads a T750–T850 is more appropriate | Match ash class to product type; do not default to T450 for all bread |
| Moisture max 15% | Baker ignores moisture at delivery | Flour above 14% moisture is at risk for mould growth in storage; hydration calculations go wrong | Test incoming moisture at goods-in; adjust recipe water if flour moisture deviates from target |
| Wet gluten % min | Baker confuses wet gluten % with protein % | Wet gluten ≈ 2.5–3× protein; mixing them up causes serious hydration and dough-strength miscalculation | Remember: protein % × ~2.7 ≈ wet gluten % for typical bread wheat |
| Gluten index 75–99 | Baker assumes max gluten index (near 100) is always best | Very high gluten index (approaching 100) can mean over-tenacious gluten — difficult to machine, poor extensibility for baguette/pizza | For baguette or pizza, a gluten index of 75–85 is often more practical than 95+ |
- Ash content:
- ISO 2171 / PN-EN ISO 2171 (incineration at 550°C, result on dry matter basis)
- Falling number:
- ISO 3093 / PN-EN ISO 3093 (Hagberg-Perten method)
- Wet gluten:
- ISO 21415 / PN-EN ISO 21415 (mechanical washing, e.g. Glutomatic)
- Gluten index:
- ISO 7495 (centrifuge sieve method, 0–100 scale)
- Protein:
- ISO 20483 / Kjeldahl Nx5.7 (wheat) or Nx6.25 (oat)
- Moisture:
- ISO 712 / PN-EN ISO 712 (oven drying)
- Zeleny:
- ISO 5529 (sedimentation in lactic acid solution)
- Alveograph:
- ISO 27971 (Chopin Alveograph: W, P, L, G parameters)
- Farinograph:
- ISO 5530-1 (Brabender Farinograph: water absorption, development time, stability, MTI)
- White sandwich bread:
- Ash content, Protein, Wet gluten, Gluten index, Falling number, Moisture
- Rustic sourdough:
- Falling number, Zeleny, Alveograph W and P/L, Wet gluten, Ash content
- Baguette pizza:
- Alveograph W and P/L, Protein, Wet gluten, Falling number
- Croissant danish:
- Alveograph W and P/L, Protein, Moisture
- Rye bread:
- Falling number, Ash content, Moisture
- Pastry cake:
- Ash content, Protein, Moisture
Buy the ingredients
Catalogue products and brands referenced in this article.
Wheat Flour Type 450 25 kg

Wheat Flour Type G 550 25 kg

Rye Flour Type 720 20 kg

Wheat Flour Type 850 25 kg

Oat Flour 25 kg

Domson Bread Flour Type 750 25 kg

Komplexmłyn Wheat Flour Type 550 25 kg
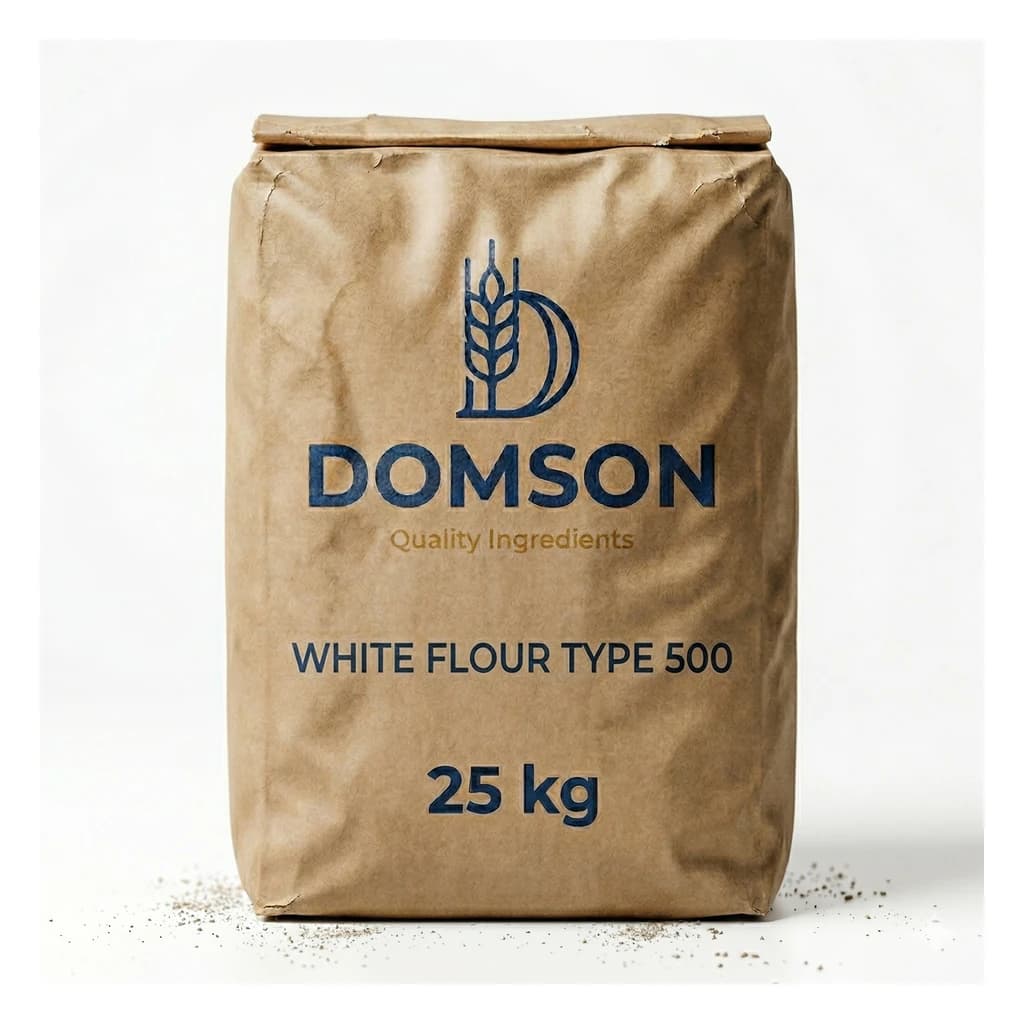
Domson White Flour Type 500 25 kg
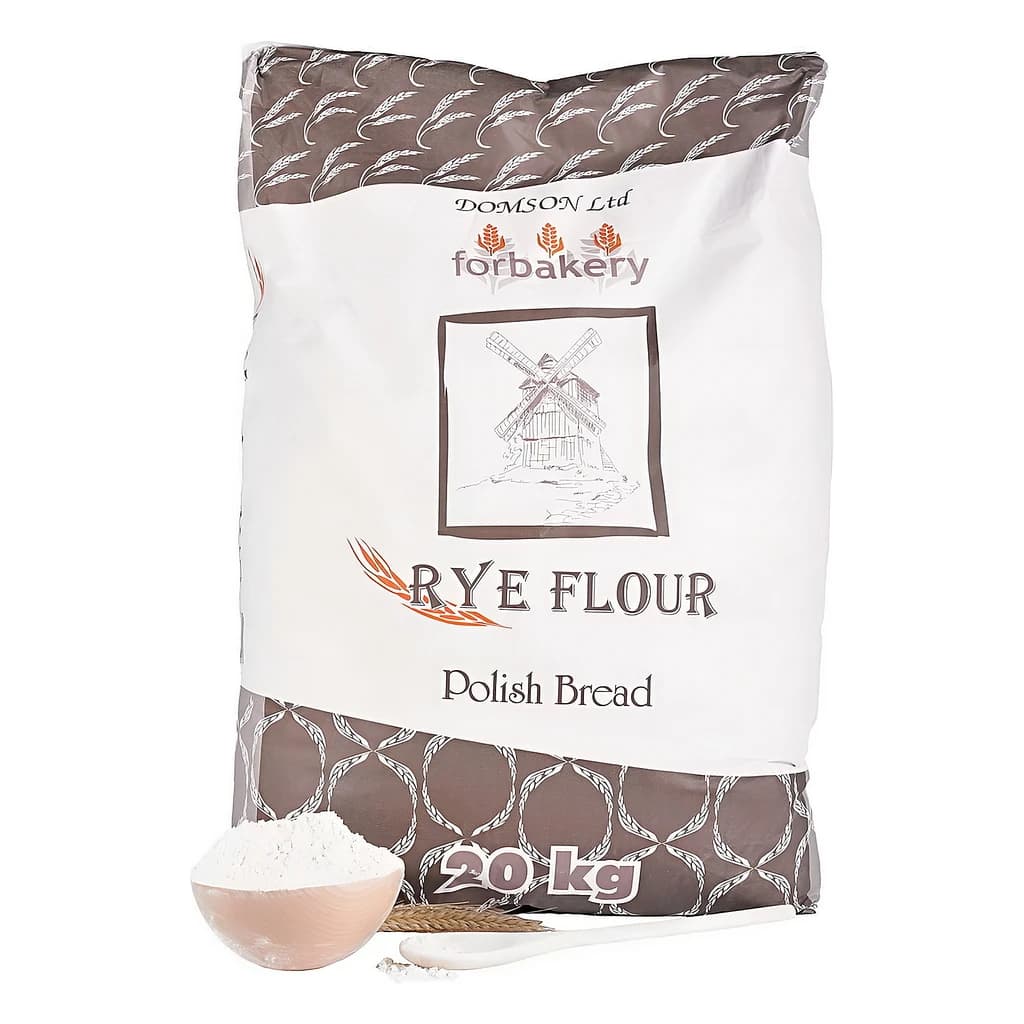
Rye Flour Type 720 25 kg

Wholemeal Rye Flour Type 2000 40 kg

Windrush Strong White Bread Flour 16 kg

Stoneground White Spelt Flour 16 kg